Case Study
This case study demonstrates the application of the TRIAGE analysis pipeline using a publicly available single-nucleus RNA sequencing (snRNA-seq) dataset.
Data Source:
Dataset: Kuppe et al., Nature 2022, Spatial multi-omic map of human myocardial infarction.
Data Available at: https://www.nature.com/articles/s41586-022-05060-x#data-availability
The demonstration uses control endothelial and pericyte cells to showcase the TRIAGE analysis pipeline.
Objective: To apply TRIAGEcluster for cell clustering, byPeak() for calculating average expression data by various categories, TRIAGEgene for generating TRIAGE-weighted expression data, plotJaccard() for Jaccard Index Heatmap visualization, TRIAGEparser to dissect gene clusters and their associated ontologies, and plotGO() for GO enrichment visualization.
Steps:
TRIAGEcluster + byPeak()
TRIAGEgene + plotJaccard()
TRIAGEparser + plotGO()
# Load packages and set up the working directory
library(TRIAGE)
library(reticulate)
setwd("/path/to/working/directory")
Step 1: Run TRIAGEcluster for cell clustering, select a suitable bandwidth resolution based on UMAP reviews, and calculate average gene expression by various categories using the byPeak() function.
# Run TRIAGEcluster
expr_file <- system.file("extdata", "TRIAGEcluster_demo_expr_human.csv", package = "TRIAGE")
metadata_file <- system.file("extdata", "TRIAGEcluster_demo_metadata_human.csv", package = "TRIAGE")
TRIAGEcluster(expr_file, metadata_file, outdir = "tests", output_prefix = "demo")

# Select a suitable bandwidth and calculate average gene expression
peak_file <- "tests/demo_bw0.80_metadata.csv"
avg_peak <- byPeak(expr_file, peak_file)
# Save the average gene expression result to a CSV file
write.csv(avg_peak, file = "tests/AverageByPeak.csv", row.names = TRUE, quote = FALSE)
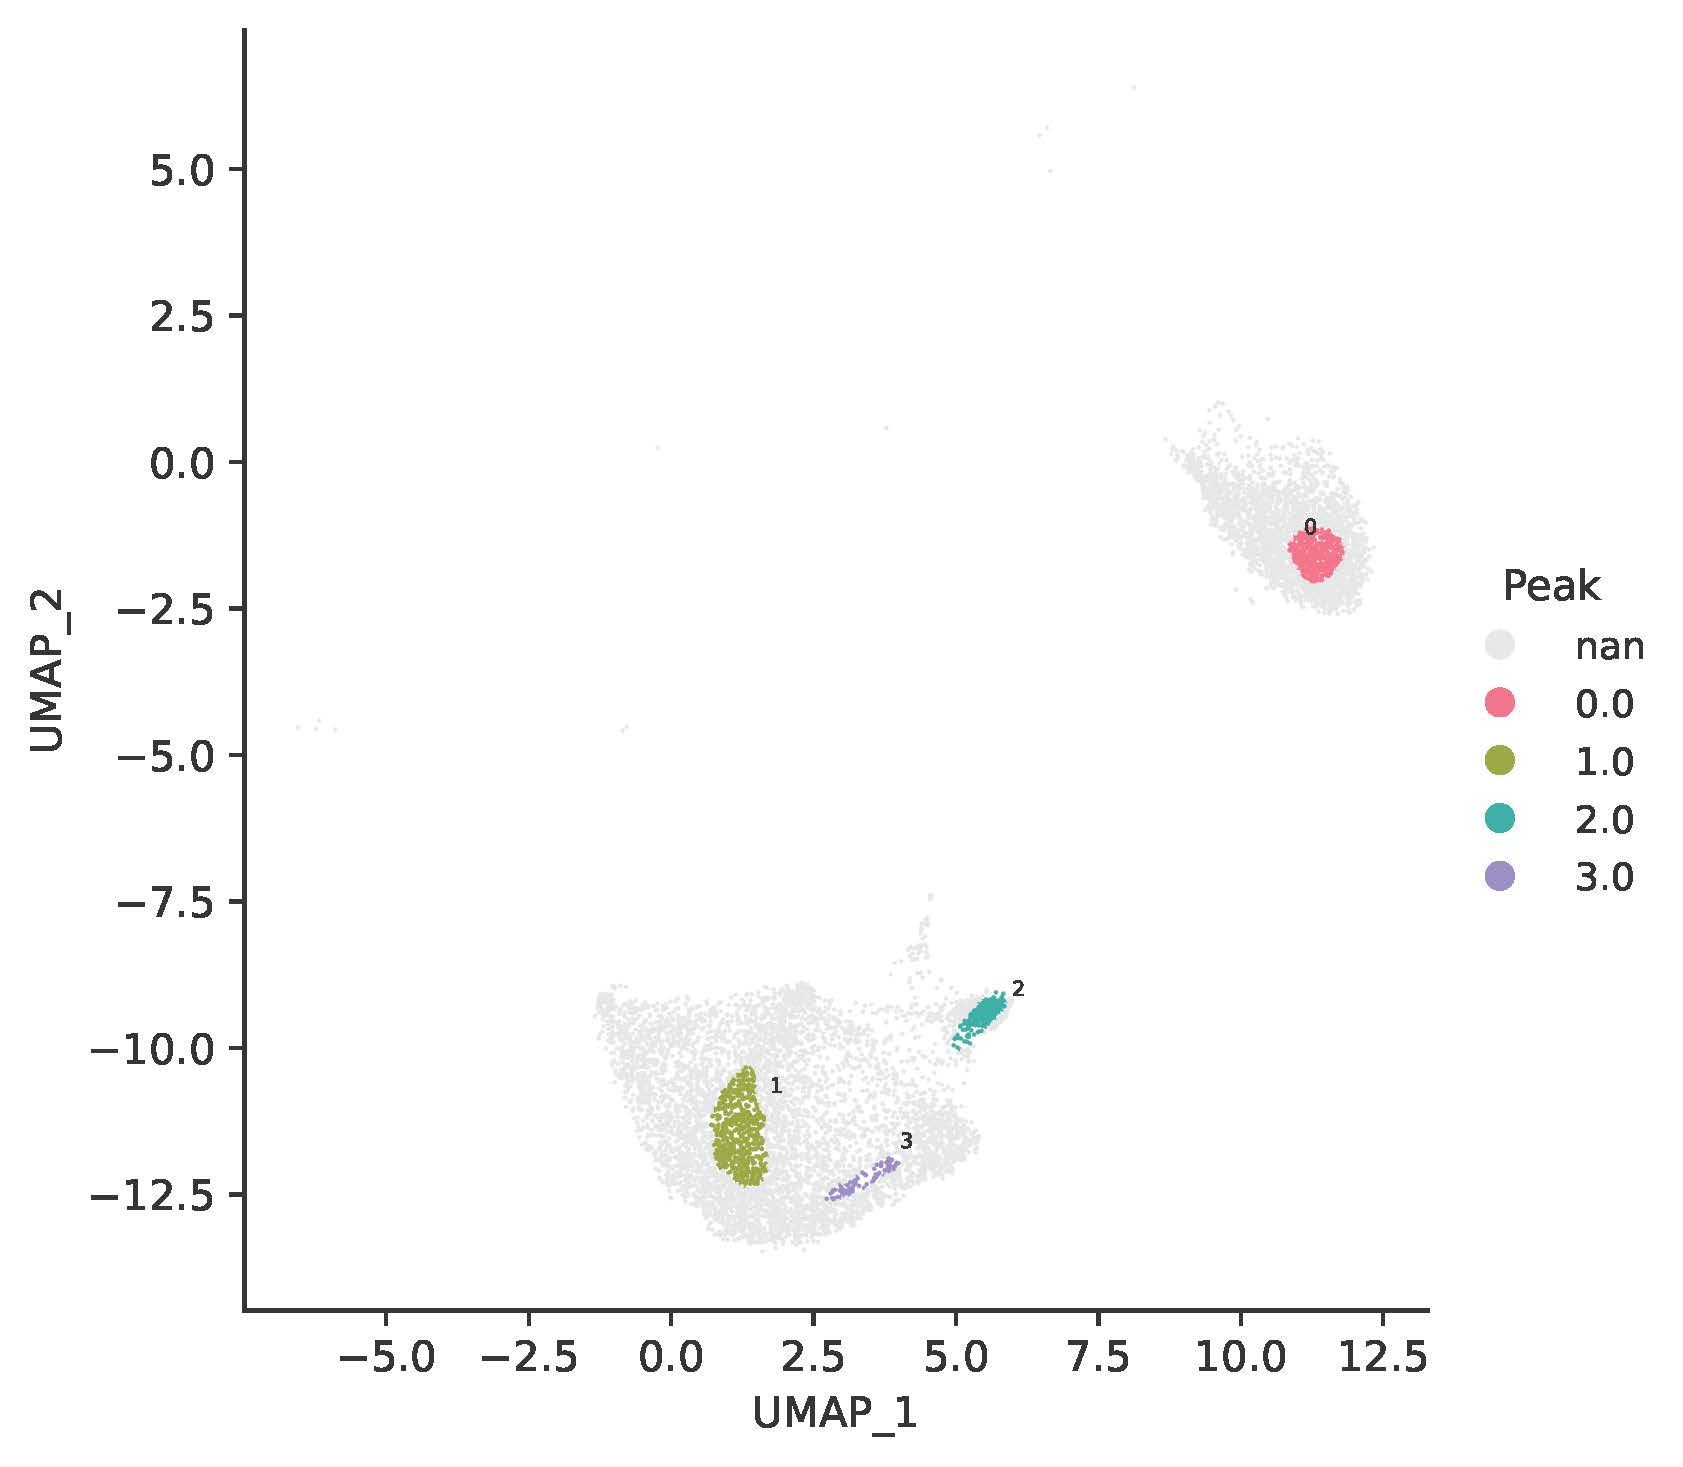
TRIAGEcluster generates nine UMAPs with bandwidths from 0.1 to 0.9, and a corresponding set of metadata files. Here, a bandwidth of 0.8 was selected for downstream application, resulting in four TRIAGEcluster-defined peaks within the UMAP.
A snippet of the “AverageByPeak.csv” file is shown below:
Peak0 |
Peak1 |
Peak2 |
Peak3 |
|
|---|---|---|---|---|
ALDH1A2 |
0.04404541 |
0.04426352 |
1.18265890 |
0.12415153 |
PRRX1 |
0.63263328 |
0.19289223 |
0.08957362 |
0.11108879 |
NOVA2 |
0.00785169 |
0.31212372 |
0.22311596 |
0.28179011 |
NGFR |
0.07502976 |
0.01140611 |
0.01078702 |
0.02280367 |
MCF2L |
0.03431053 |
1.41983845 |
0.25927713 |
1.39706381 |
TBX4 |
0 |
0 |
0 |
0 |
… |
… |
… |
… |
… |
Step 2: Run TRIAGEgene to generate TRIAGE-weighted expression data and plotJaccard() to generate Jaccard similarity index heatmap.
# Run TRIAGEgene to generate TRIAGE-weighted expression data (DS)
ds <- TRIAGEgene(avg_peak)
# Save the average DS result to a CSV file
write.csv(ds, file = "tests/AverageByPeak_DS.csv", row.names = TRUE, quote = FALSE)
# Save the average DS result to a tab-delimited text file
write.table(ds, file = "tests/AverageByPeak.txt", sep = "\t",
            row.names = TRUE, col.names = NA, quote = FALSE)

# Generate Jaccard Index Heatmap
plotJaccard(ds, "tests/Jaccard_heatmap_peak.pdf")
A snippet of the “AverageByPeak_DS.csv” file is shown below:
Peak0 |
Peak1 |
Peak2 |
Peak3 |
|
|---|---|---|---|---|
ALDH1A2 |
0.000685619 |
0.000689014 |
0.018409486 |
0.001932566 |
PRRX1 |
0.019265802 |
0.005874214 |
0.002727817 |
0.003383026 |
NOVA2 |
0.000207595 |
0.008252406 |
0.005899082 |
0.0074504 |
NGFR |
0.012602077 |
0.001915782 |
0.001811799 |
0.003830128 |
MCF2L |
0.000594645 |
0.024607587 |
0.004493599 |
0.024212873 |
TBX4 |
0 |
0 |
0 |
0 |
… |
… |
… |
… |
… |
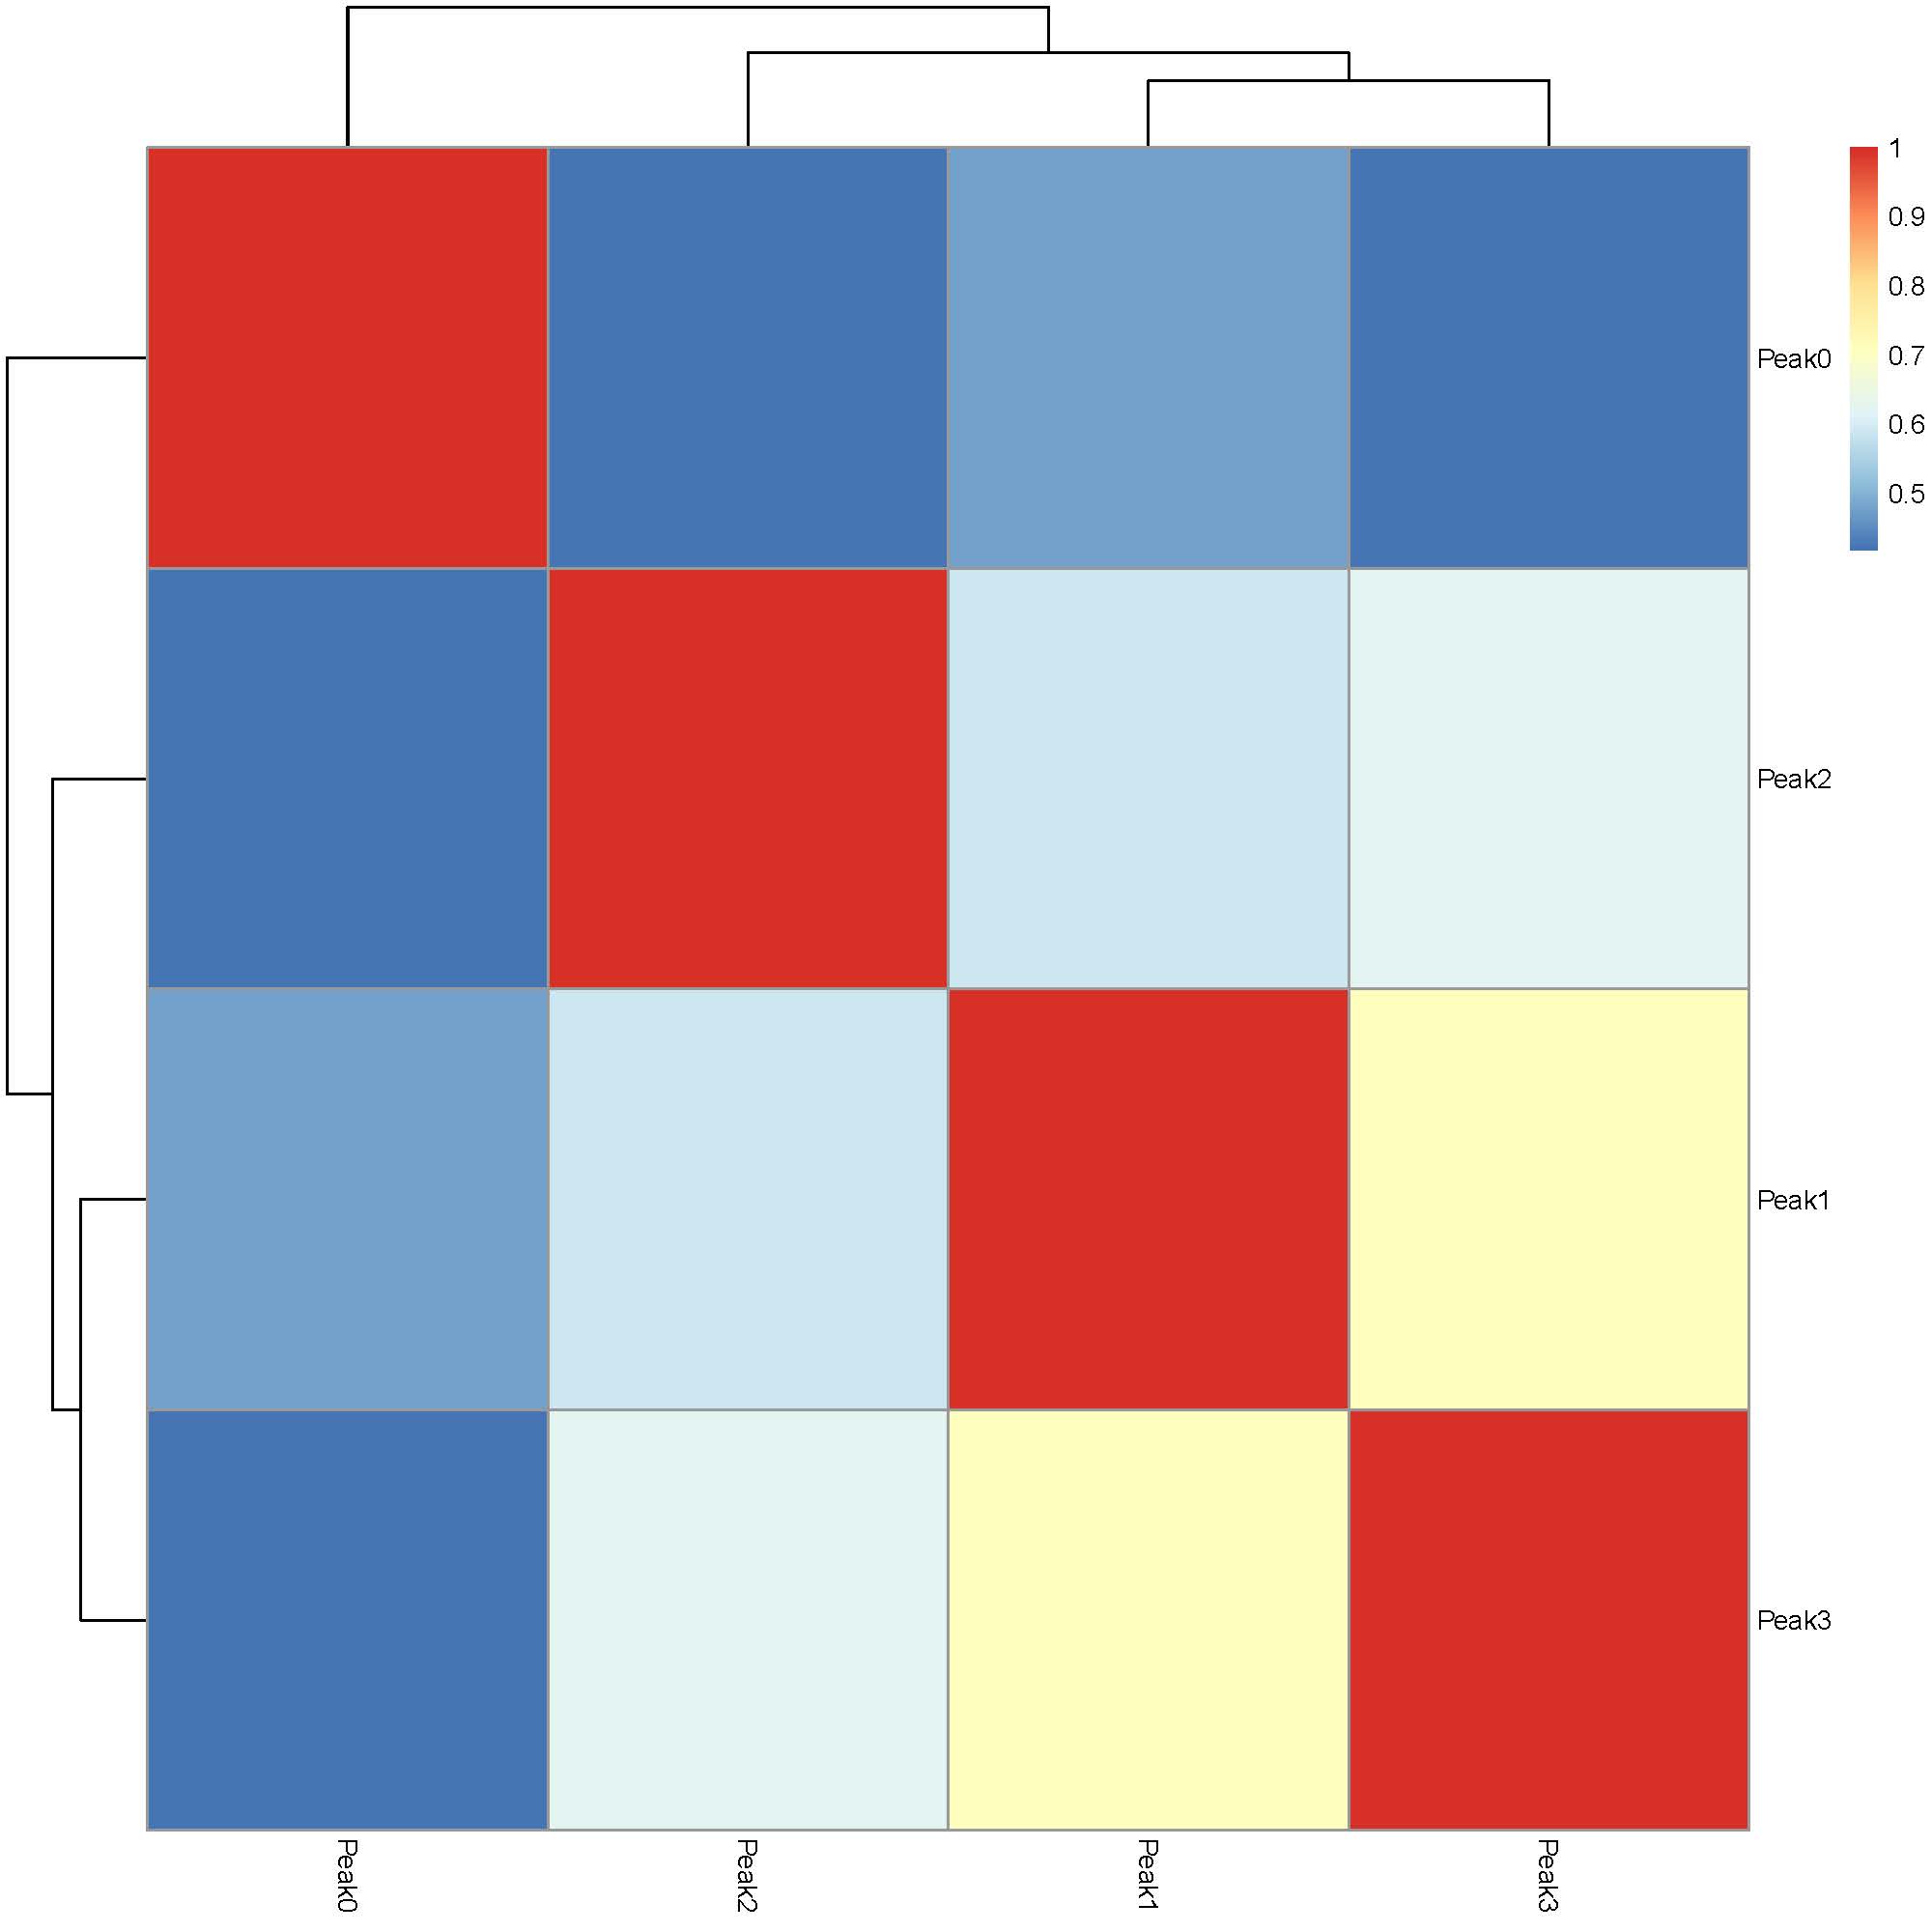
The plotJaccard() function generates a heatmap to visualize the extent of similarity across identified peaks:
Step 3: Run TRIAGEparser to dissect gene clusters and their associated ontologies and plotGO() to generate GO enrichment heatmaps.
# Run TRIAGEparser to dissect gene clusters and their associated ontologies
input_file <- "tests/AverageByPeak_DS.csv"
TRIAGEparser(input_file, input_type = "table", outdir="tests/TRIAGEparser_peak")

# Generate GO Heatmaps
plotGO(indir="tests/TRIAGEparser_peak", outdir="tests/TRIAGEparser_peak")
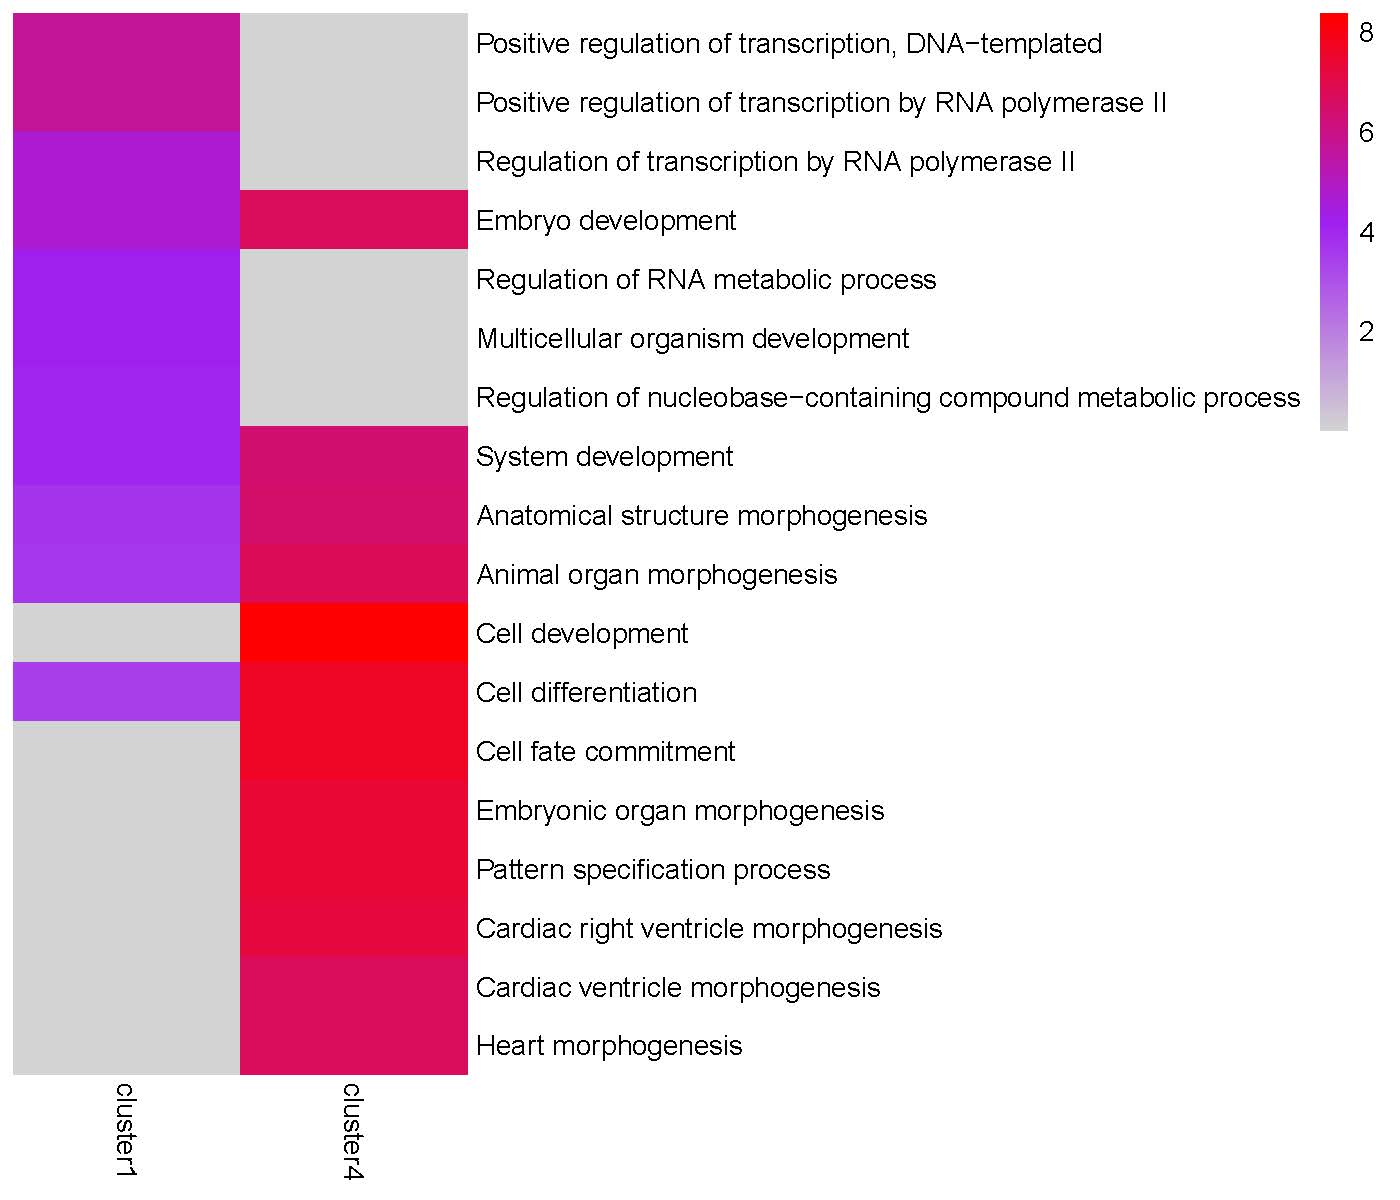
The TRIAGEparser output comprises gene clusters and their associated Gene Ontology (GO) enrichments, which are organized into two separate folders named “gene_cluster” and “go”. The plotGO() function generates heatmaps for gene clusters in each peak. The folder structure is illustrated below:

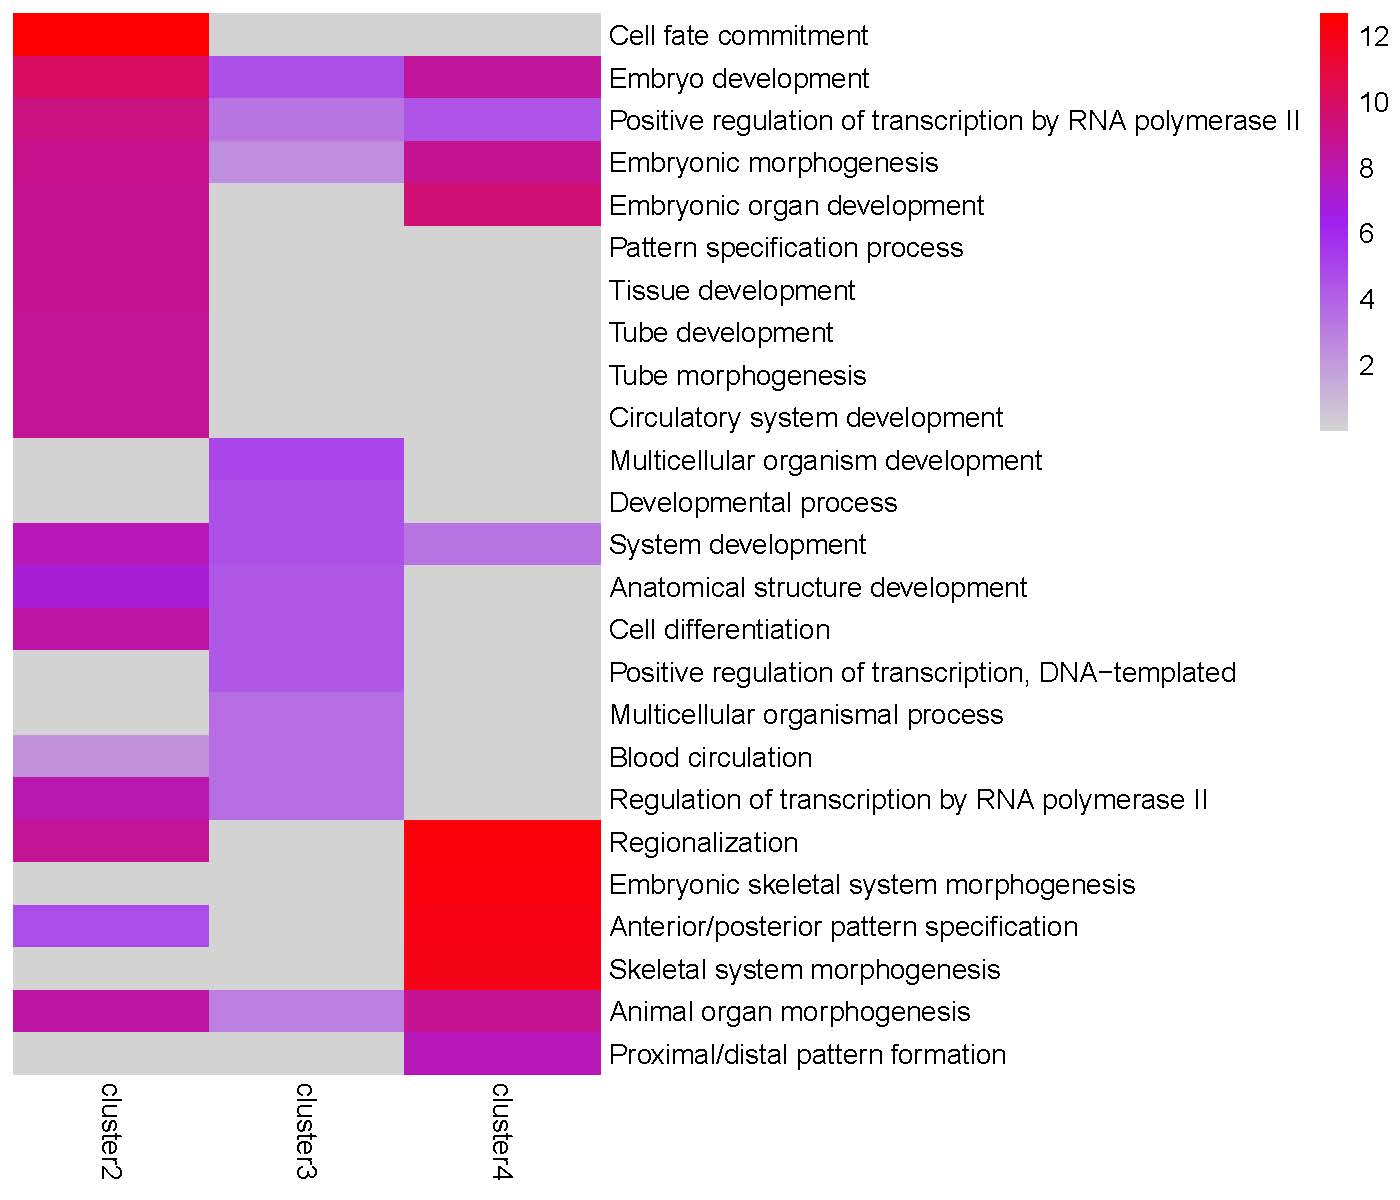
GO enrichment heatmap for the ‘Peak0’ cluster:
GO enrichment heatmap for the ‘Peak1’ cluster:
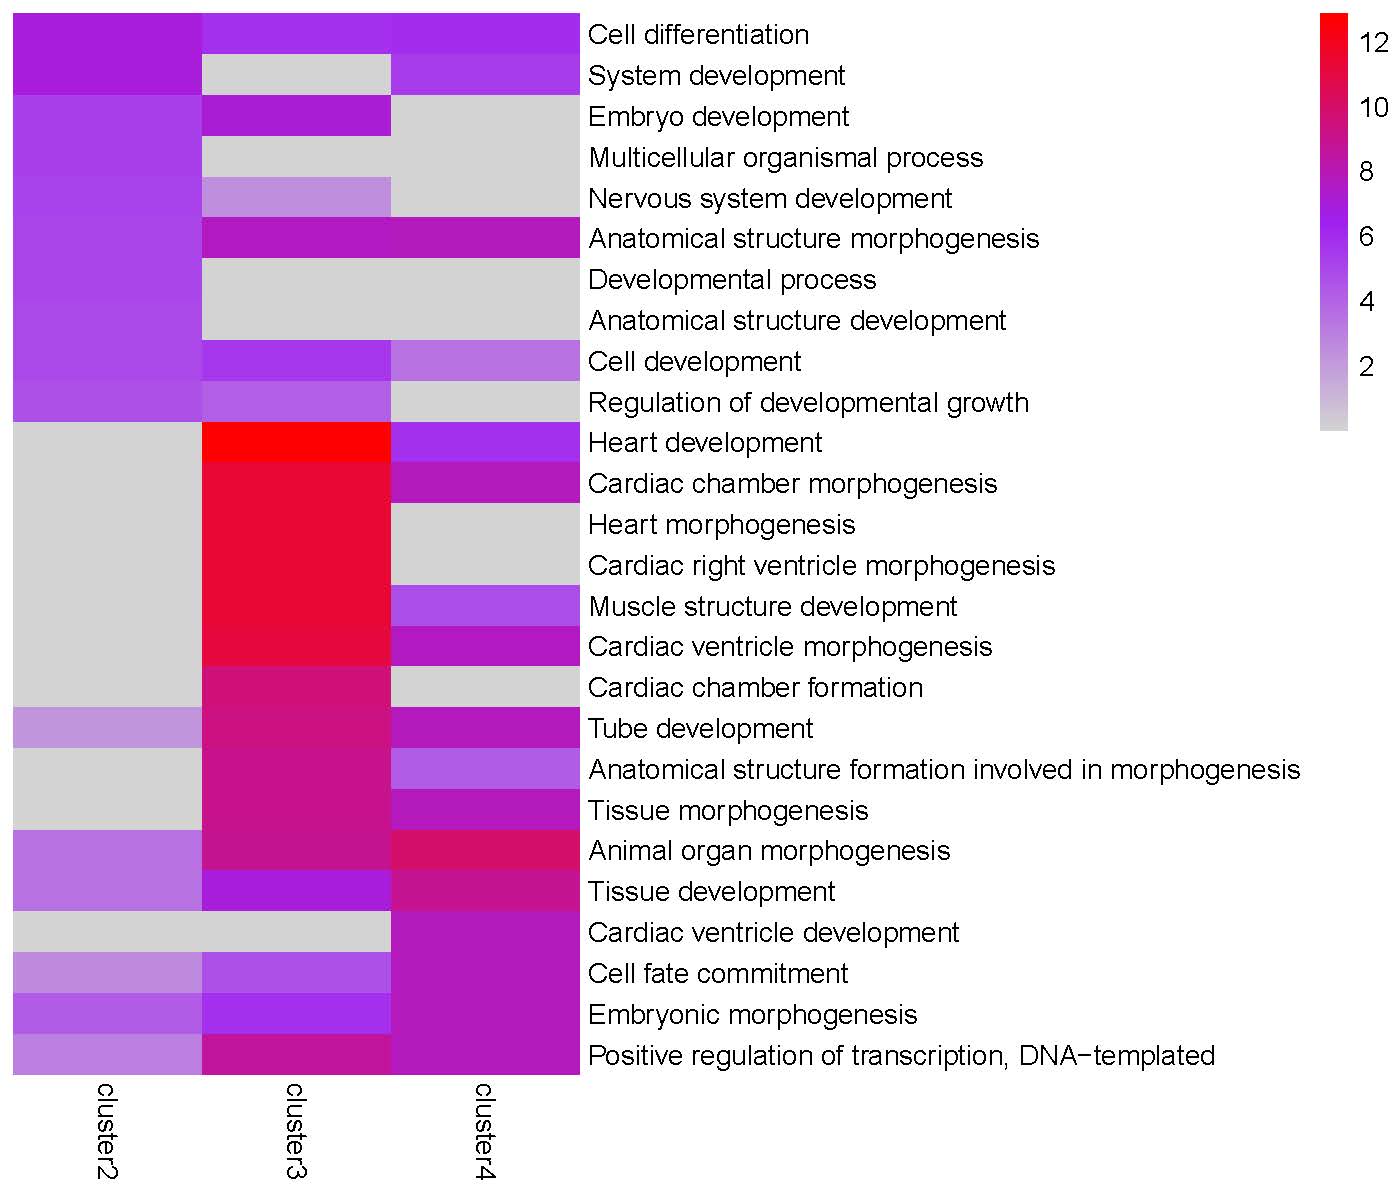
GO enrichment heatmap for the ‘Peak2’ cluster:
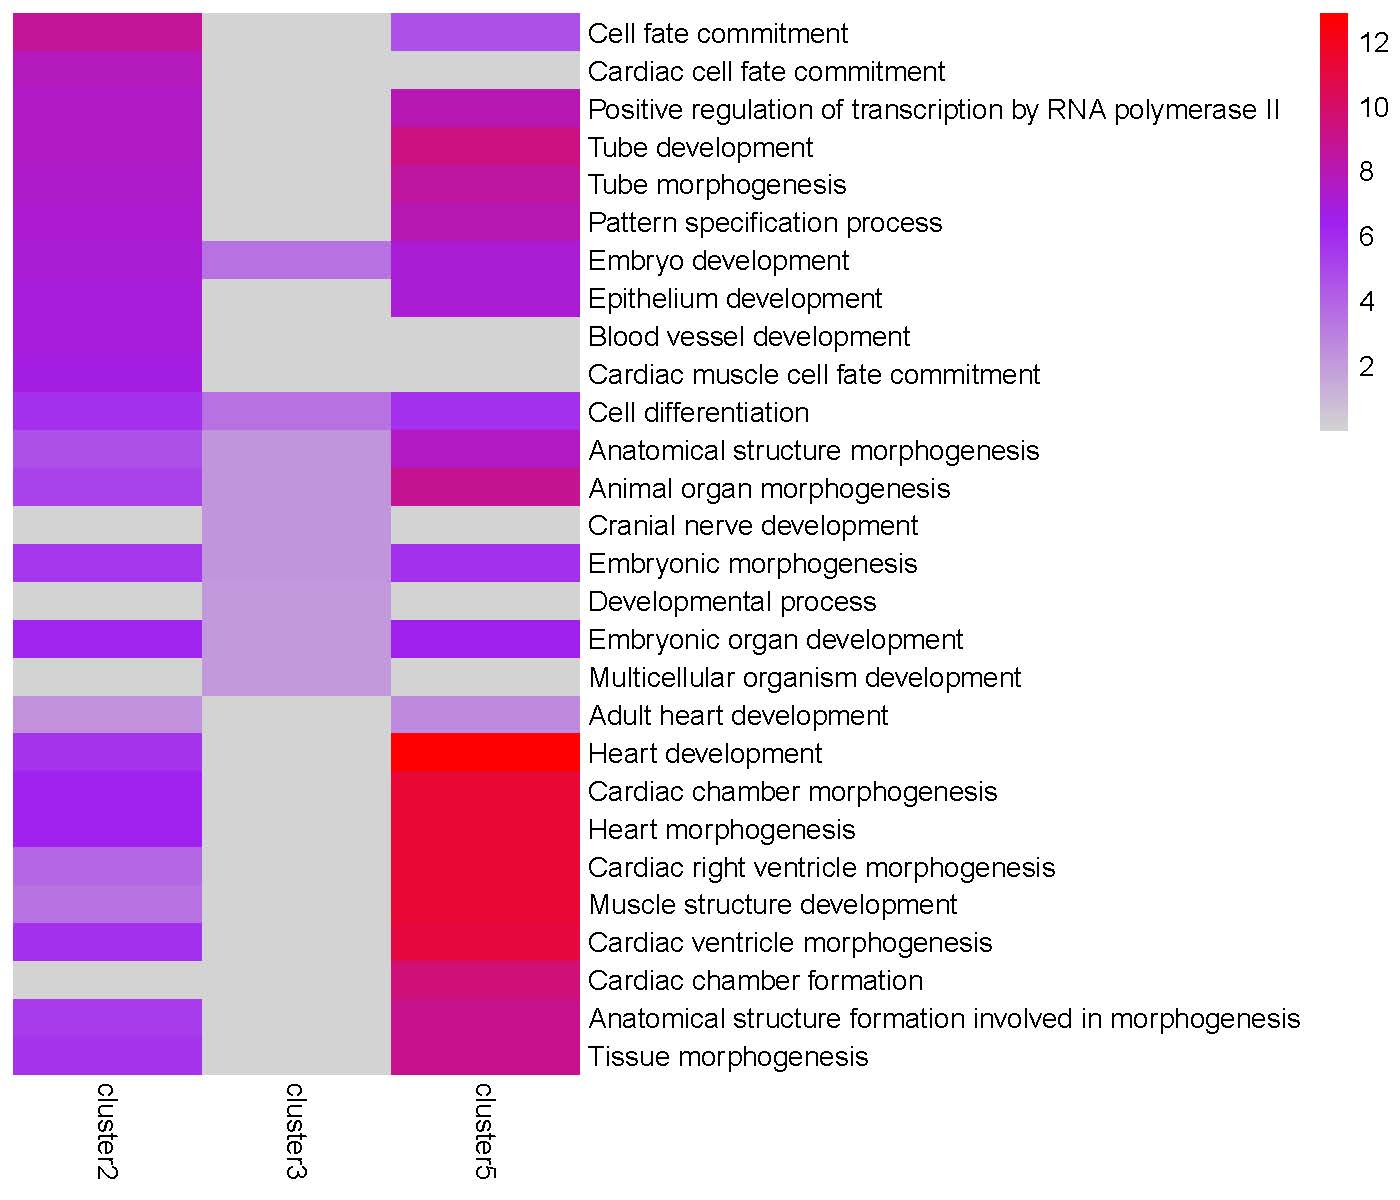
GO enrichment heatmap for the ‘Peak3’ cluster:
Alternative Calculations 1: Average Gene Expression by Cluster:
Objective: To calculate average gene expression based on cluster categories using byPeak() function, followed by TRIAGEgene analysis and Jaccard index heatmap generation.
expr_file <- system.file("extdata", "TRIAGEcluster_demo_expr_human.csv", package = "TRIAGE")
peak_file <- "tests/demo_bw0.80_metadata.csv"

# Calculate average gene expression by cluster
avg_cluster <- byPeak(expr_file, peak_file, peak_col = "final_cluster")
write.csv(avg_cluster, file = "tests/AverageByCluster.csv", row.names = TRUE, quote = FALSE)

# Run TRIAGEgene
ds_cluster <- TRIAGEgene(avg_cluster)
write.csv(ds_cluster, file = "tests/AverageByCluster_DS.csv", row.names = TRUE, quote = FALSE)

# Generate Jaccard index heatmap
plotJaccard(ds_cluster, "tests/Jaccard_heatmap_cluster.pdf")

# Run TRIAGEparser
input_file <- "tests/AverageByCluster_DS.csv"
TRIAGEparser(input_file, input_type = "table", outdir="tests/TRIAGEparser_cluster")

# Generate GO Heatmaps
plotGO(indir="tests/TRIAGEparser_cluster", outdir="tests/TRIAGEparser_cluster")
Alternative Calculations 2: Average Gene Expression by Cell Type
Objective: To calculate average gene expression based on cell type categories using byPeak() function, followed by TRIAGEgene analysis and Jaccard index heatmap generation.
expr_file <- system.file("extdata", "TRIAGEcluster_demo_expr_human.csv", package = "TRIAGE")
peak_file <- "tests/demo_bw0.80_metadata.csv"

# Calculate average gene expression by cell type
avg_celltype <- byPeak(expr_file, peak_file, peak_col = "cell_type")
write.csv(avg_celltype, file = "tests/AverageByCelltype.csv", row.names = TRUE, quote = FALSE)

# Run TRIAGEgene
ds_celltype <- TRIAGEgene(avg_celltype)
write.csv(ds_celltype, file = "tests/AverageByCelltype_DS.csv", row.names = TRUE, quote = FALSE)

# Generate Jaccard index heatmap
plotJaccard(ds_celltype, "tests/Jaccard_heatmap_celltype.pdf")

# Run TRIAGEparser
input_file <- "tests/AverageByCelltype_DS.csv"
TRIAGEparser(input_file, input_type = "table", outdir="tests/TRIAGEparser_celltype")

# Generate GO Heatmaps
plotGO(indir="tests/TRIAGEparser_celltype", outdir="tests/TRIAGEparser_celltype")