Case Study
This case study demonstrates the application of the TRIAGE analysis pipeline using a publicly available single-nucleus RNA sequencing (snRNA-seq) dataset.
Data Source:
Dataset: Kuppe et al., Nature 2022, Spatial multi-omic map of human myocardial infarction.
Data Available at: https://www.nature.com/articles/s41586-022-05060-x#data-availability
The demonstration uses control endothelial and pericyte cells to showcase the TRIAGE analysis pipeline.
Objective: To apply TRIAGEcluster for cell clustering, byPeak() for calculating average expression data by various categories, TRIAGEgene for generating TRIAGE-weighted expression data, plotJaccard() for Jaccard Index Heatmap visualization, TRIAGEparser for dissecting gene clusters and their associated ontologies, plotGO() for GO enrichment visualization, and getClusterGenes() for the extraction of genes from TRIAGEparser clusters.
Steps:
TRIAGEcluster + byPeak()
TRIAGEgene + plotJaccard()
TRIAGEparser + plotGO()
getClusterGenes()
# Load packages and set up the working directory
library(TRIAGE)
library(reticulate)
setwd("/path/to/working/directory")
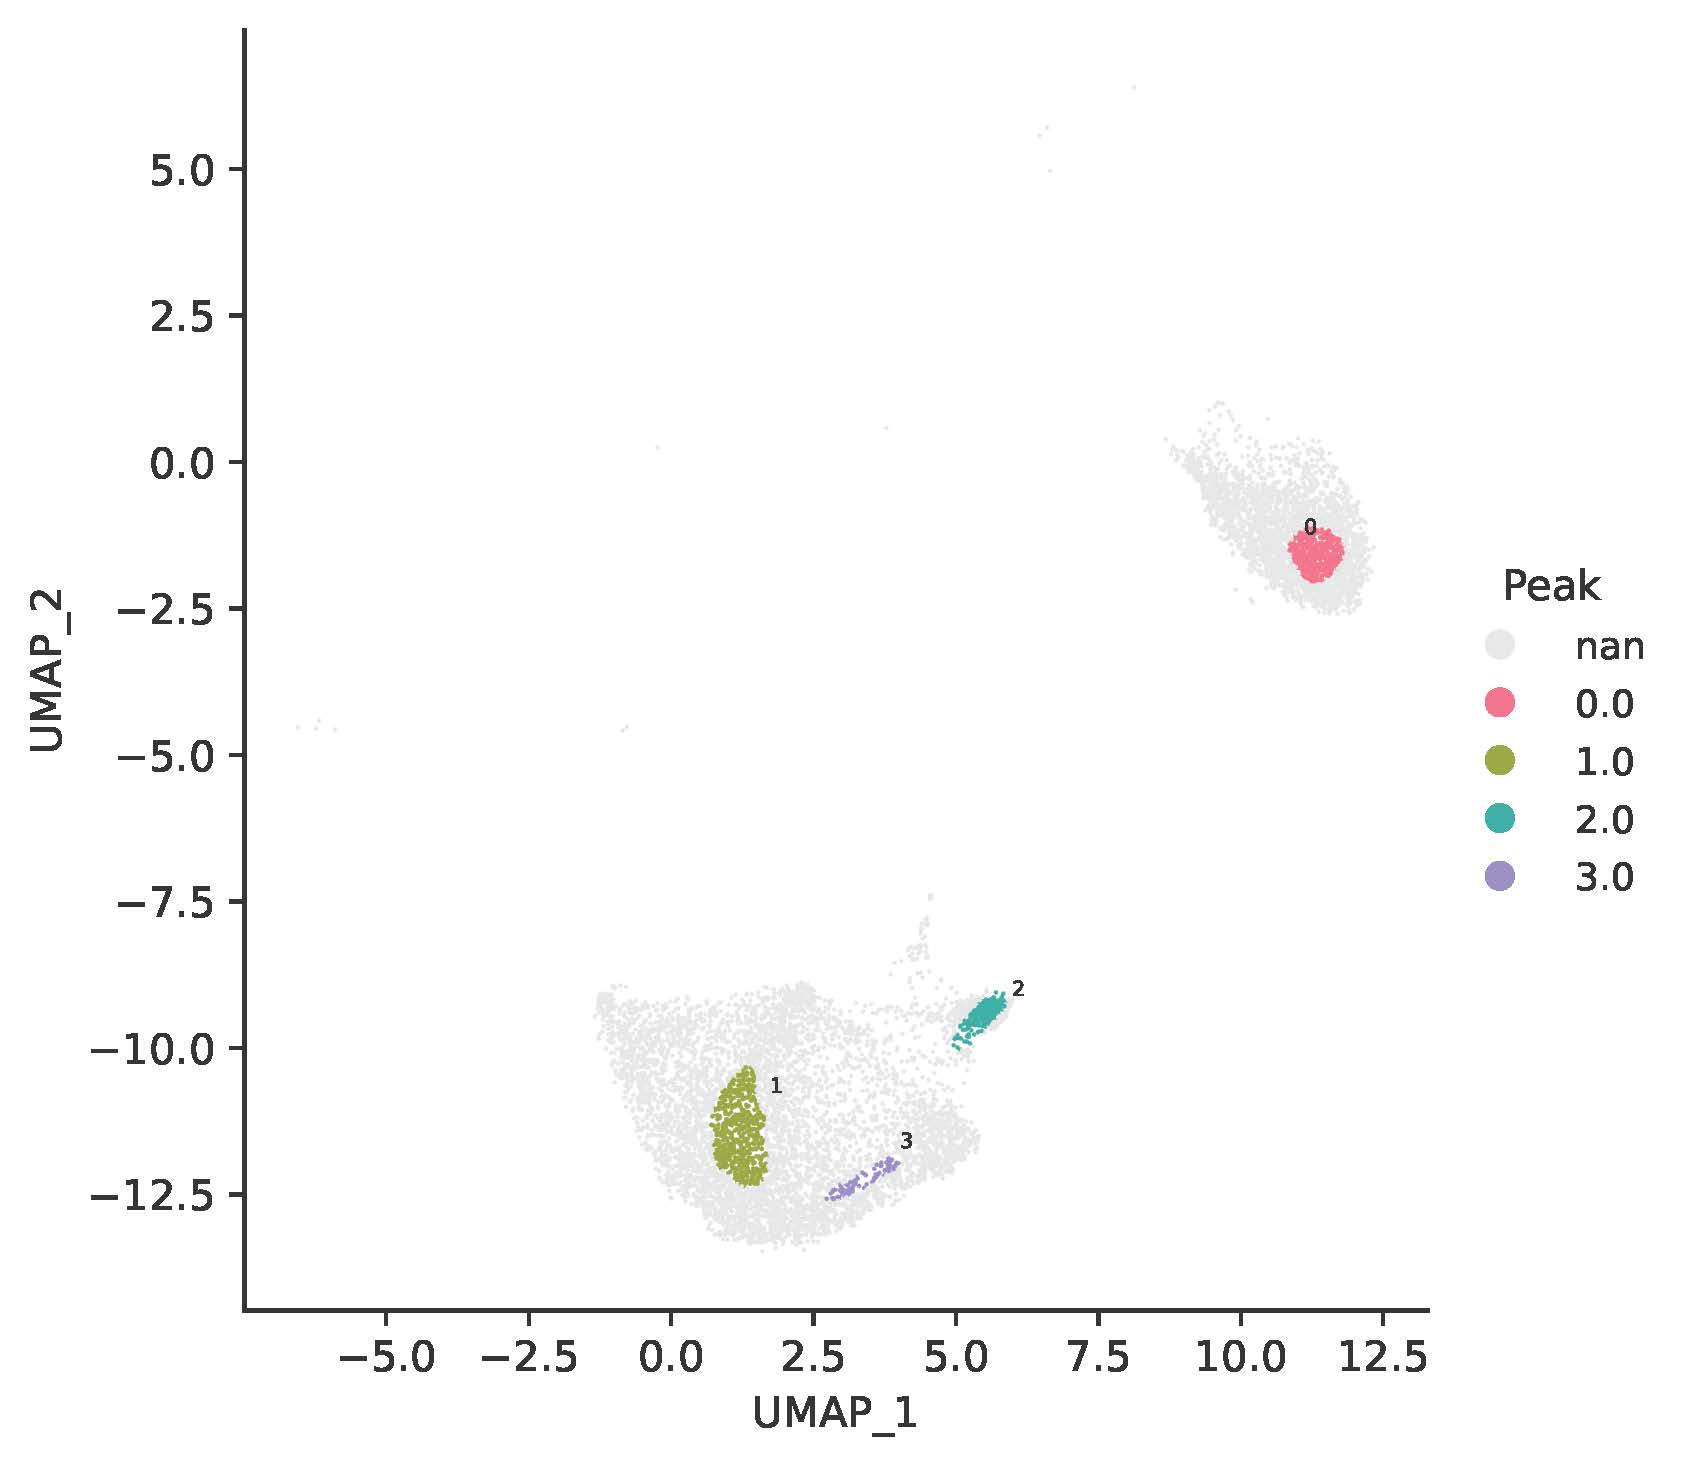
Step 1: Run TRIAGEcluster for cell clustering, select a suitable bandwidth resolution based on UMAP reviews, and calculate average gene expression by various categories using the byPeak() function.
# Run TRIAGEcluster
expr_file <- system.file("extdata", "TRIAGEcluster_demo_expr_human.csv", package = "TRIAGE")
metadata_file <- system.file("extdata", "TRIAGEcluster_demo_metadata_human.csv", package = "TRIAGE")
TRIAGEcluster(expr_file, metadata_file, outdir = "tests", output_prefix = "demo")

# Select a suitable bandwidth and calculate average gene expression
peak_file <- "tests/demo_bw0.80_metadata.csv"
avg_peak <- byPeak(expr_file, peak_file)
# Save the average gene expression result to a CSV file
write.csv(avg_peak, file = "tests/AverageByPeak.csv", row.names = TRUE, quote = FALSE)
TRIAGEcluster generates nine UMAPs with bandwidths from 0.1 to 0.9, and a corresponding set of metadata files. Here, a bandwidth of 0.8 was selected for downstream application, resulting in four TRIAGEcluster-defined peaks within the UMAP.
A snippet of the “AverageByPeak.csv” file is shown below:
Peak0 |
Peak1 |
Peak2 |
Peak3 |
|
|---|---|---|---|---|
ALDH1A2 |
0.04404541 |
0.04426352 |
1.18265890 |
0.12415153 |
PRRX1 |
0.63263328 |
0.19289223 |
0.08957362 |
0.11108879 |
NOVA2 |
0.00785169 |
0.31212372 |
0.22311596 |
0.28179011 |
NGFR |
0.07502976 |
0.01140611 |
0.01078702 |
0.02280367 |
MCF2L |
0.03431053 |
1.41983845 |
0.25927713 |
1.39706381 |
TBX4 |
0 |
0 |
0 |
0 |
… |
… |
… |
… |
… |
Step 2: Run TRIAGEgene to generate TRIAGE-weighted expression data and plotJaccard() to generate Jaccard similarity index heatmap.
# Run TRIAGEgene to generate TRIAGE-weighted expression data (DS)
ds <- TRIAGEgene(avg_peak)
# Save the average DS result to a CSV file
write.csv(ds, file = "tests/AverageByPeak_DS.csv", row.names = TRUE, quote = FALSE)
# Save the average DS result to a tab-delimited text file
write.table(ds, file = "tests/AverageByPeak.txt", sep = "\t",
row.names = TRUE, col.names = NA, quote = FALSE)
# Generate Jaccard Index Heatmap
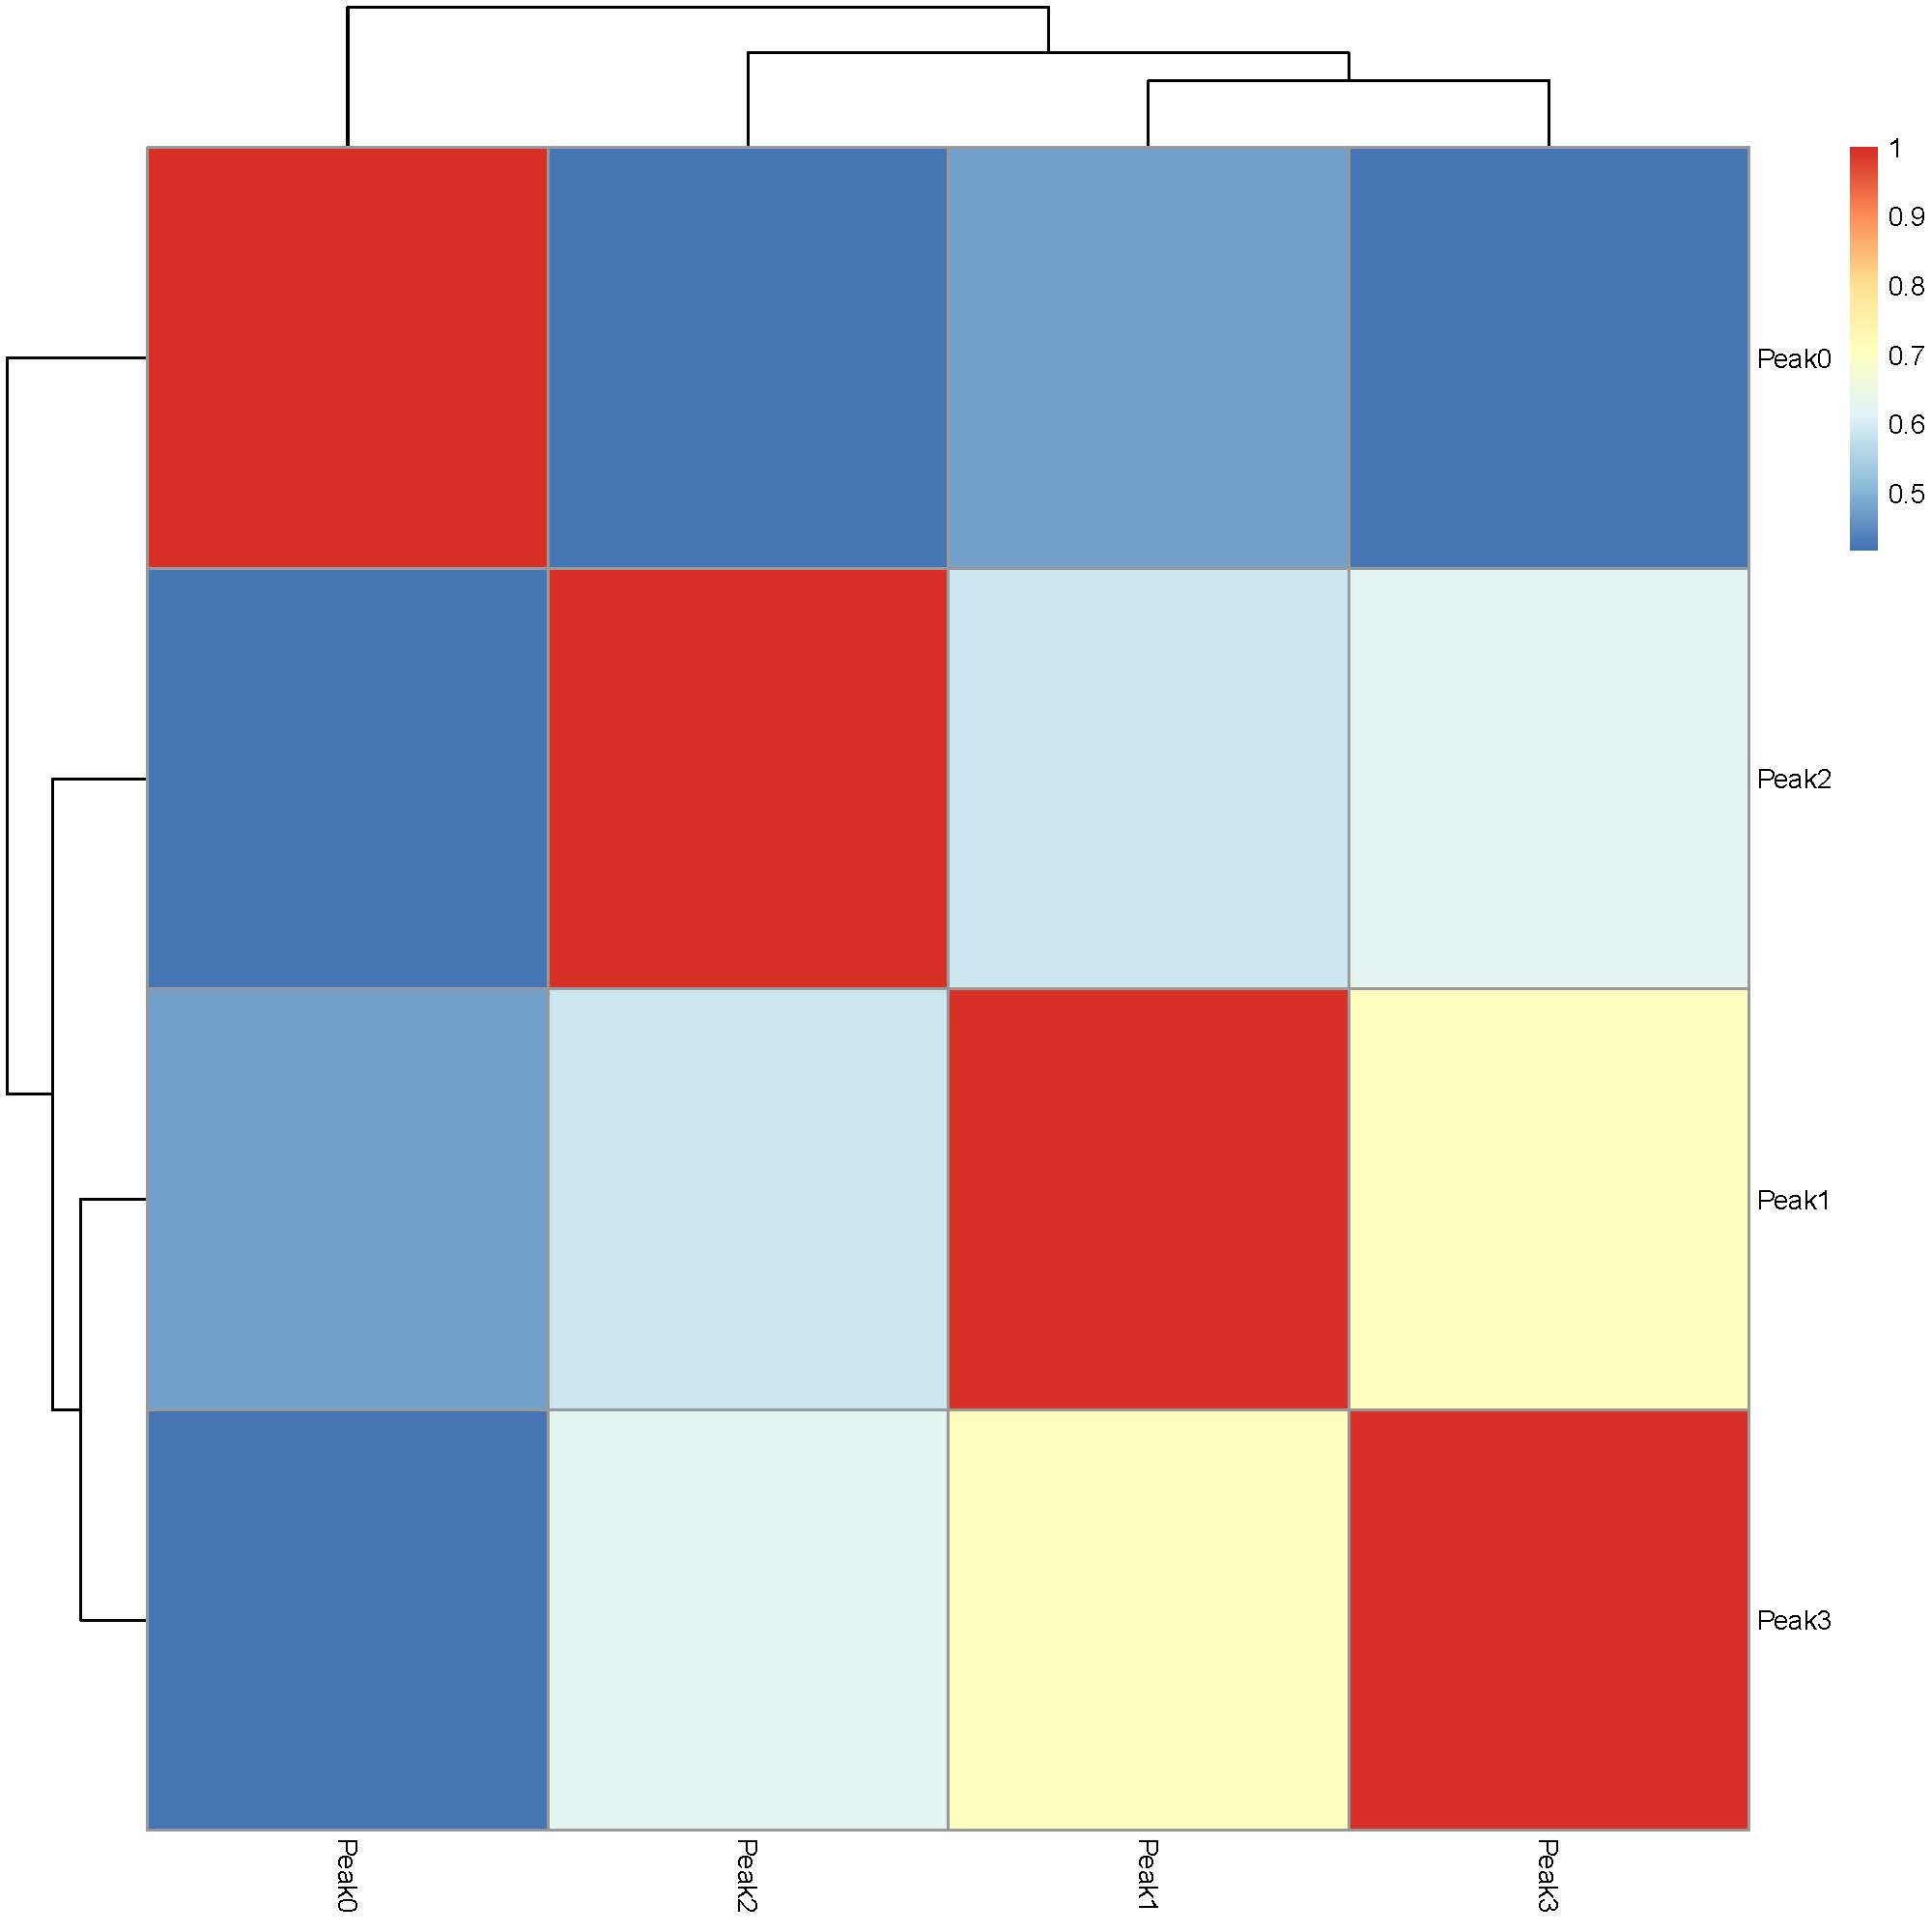
plotJaccard(ds, "tests/Jaccard_heatmap_peak.pdf")
A snippet of the “AverageByPeak_DS.csv” file is shown below:
Peak0 |
Peak1 |
Peak2 |
Peak3 |
|
|---|---|---|---|---|
ALDH1A2 |
0.000685619 |
0.000689014 |
0.018409486 |
0.001932566 |
PRRX1 |
0.019265802 |
0.005874214 |
0.002727817 |
0.003383026 |
NOVA2 |
0.000207595 |
0.008252406 |
0.005899082 |
0.0074504 |
NGFR |
0.012602077 |
0.001915782 |
0.001811799 |
0.003830128 |
MCF2L |
0.000594645 |
0.024607587 |
0.004493599 |
0.024212873 |
TBX4 |
0 |
0 |
0 |
0 |
… |
… |
… |
… |
… |
The plotJaccard() function generates a heatmap to visualize the extent of similarity across identified peaks:
Step 3: Run TRIAGEparser to dissect gene clusters and their associated ontologies and plotGO() to generate GO enrichment heatmaps.
# Run TRIAGEparser to dissect gene clusters and their associated ontologies
input_file <- "tests/AverageByPeak_DS.csv"
TRIAGEparser(input_file, input_type = "table", outdir="tests/TRIAGEparser_peak")
# Generate GO Heatmaps
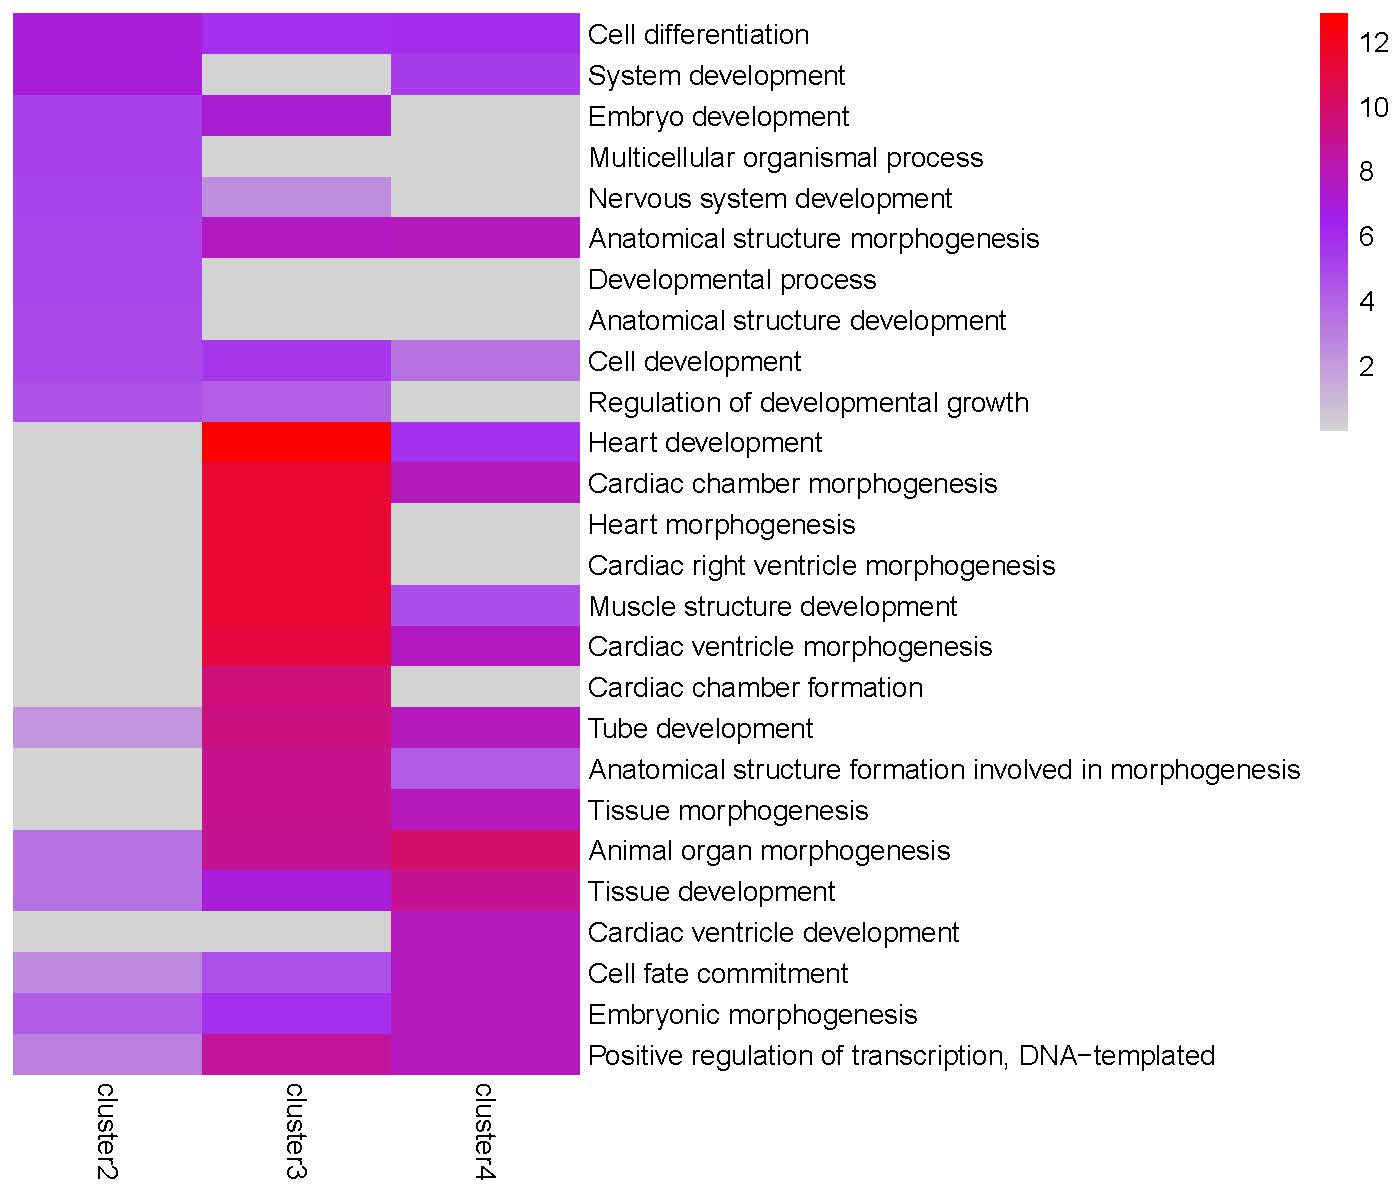
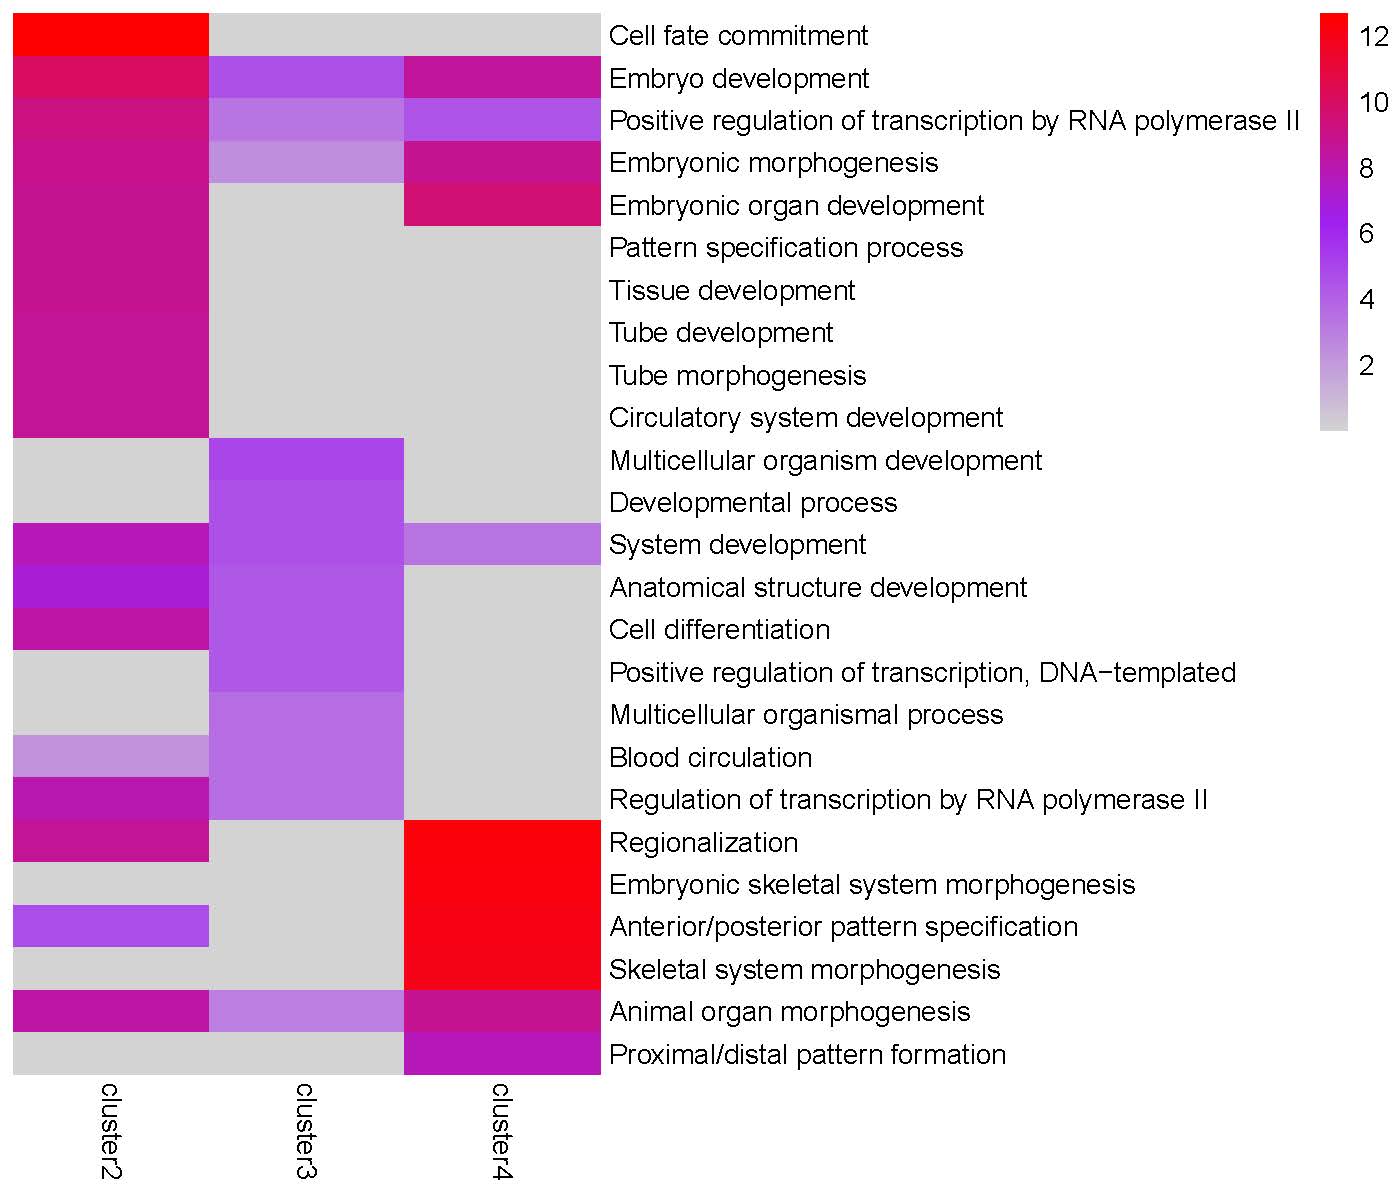
plotGO(indir="tests/TRIAGEparser_peak", outdir="tests/TRIAGEparser_peak")
The TRIAGEparser output comprises gene clusters and their associated Gene Ontology (GO) enrichments, which are organized into two separate folders named “gene_cluster” and “go”. The plotGO() function generates heatmaps for gene clusters in each peak. The folder structure is illustrated below:

GO enrichment heatmap for the ‘Peak0’ cluster:
GO enrichment heatmap for the ‘Peak1’ cluster:
GO enrichment heatmap for the ‘Peak2’ cluster:
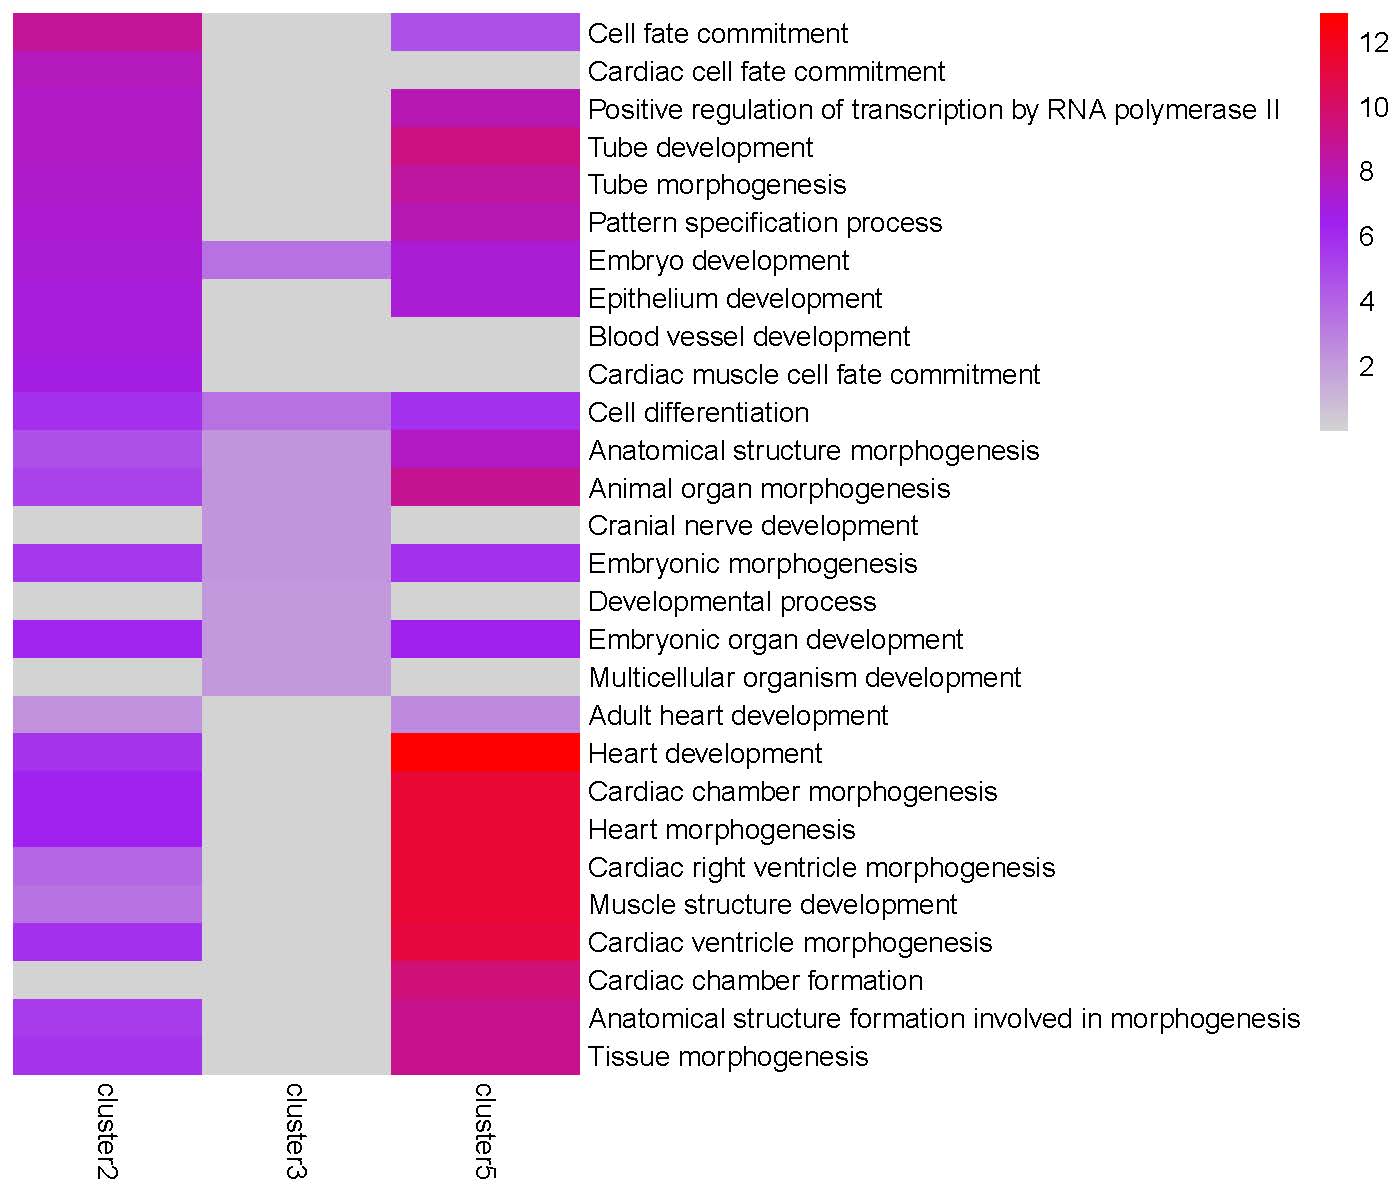
GO enrichment heatmap for the ‘Peak3’ cluster:
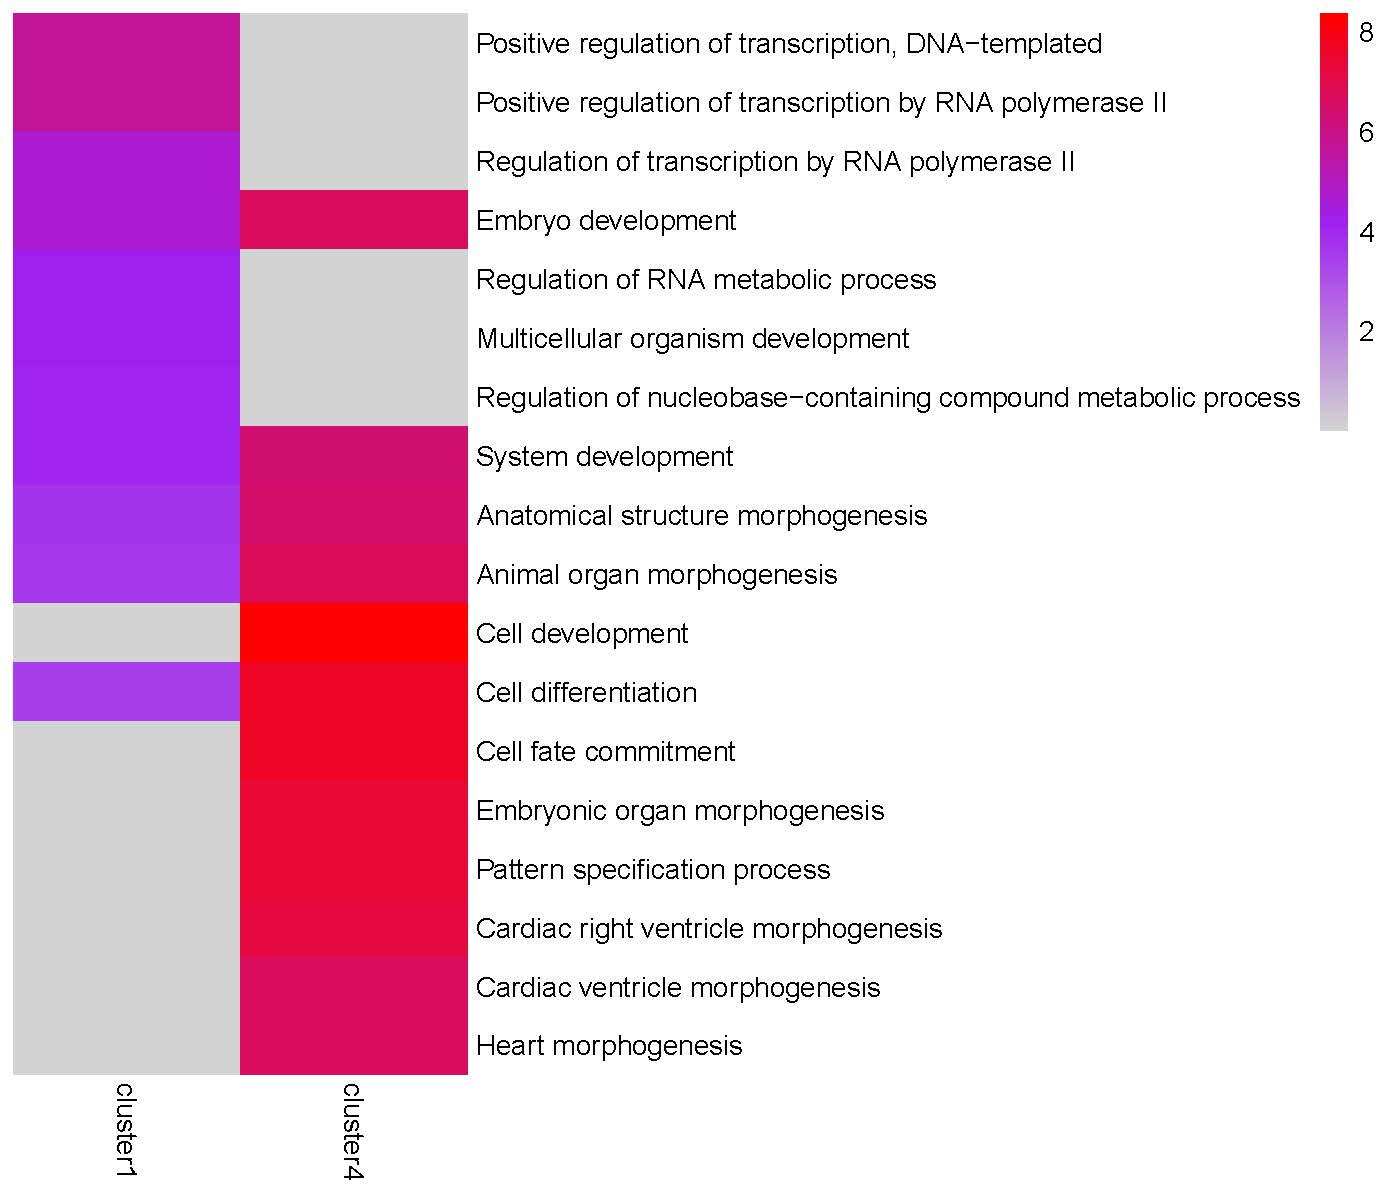
Step 4: Since the Peak3 cluster4 is highly enriched in ‘Cell differentiation’ and ‘Cell fate commitment’ terms, we use getClusterGenes() to extract genes from this gene cluster for further downstream analysis.
# Extract genes from Peak3 cluster4
Peak3_cluster4_genes <- getClusterGenes("tests/TRIAGEparser_peak/gene_cluster/Peak3_gene_clusters.csv", "cluster4")
Alternative Calculations 1: Average Gene Expression by Cluster:
Objective: To calculate average gene expression based on cluster categories using byPeak() function, followed by TRIAGEgene analysis and Jaccard index heatmap generation.
expr_file <- system.file("extdata", "TRIAGEcluster_demo_expr_human.csv", package = "TRIAGE")
peak_file <- "tests/demo_bw0.80_metadata.csv"

# Calculate average gene expression by cluster
avg_cluster <- byPeak(expr_file, peak_file, peak_col = "final_cluster")
write.csv(avg_cluster, file = "tests/AverageByCluster.csv", row.names = TRUE, quote = FALSE)

# Run TRIAGEgene
ds_cluster <- TRIAGEgene(avg_cluster)
write.csv(ds_cluster, file = "tests/AverageByCluster_DS.csv", row.names = TRUE, quote = FALSE)

# Generate Jaccard index heatmap
plotJaccard(ds_cluster, "tests/Jaccard_heatmap_cluster.pdf")

# Run TRIAGEparser
input_file <- "tests/AverageByCluster_DS.csv"
TRIAGEparser(input_file, input_type = "table", outdir="tests/TRIAGEparser_cluster")

# Generate GO Heatmaps
plotGO(indir="tests/TRIAGEparser_cluster", outdir="tests/TRIAGEparser_cluster")
Alternative Calculations 2: Average Gene Expression by Cell Type
Objective: To calculate average gene expression based on cell type categories using byPeak() function, followed by TRIAGEgene analysis and Jaccard index heatmap generation.
expr_file <- system.file("extdata", "TRIAGEcluster_demo_expr_human.csv", package = "TRIAGE")
peak_file <- "tests/demo_bw0.80_metadata.csv"

# Calculate average gene expression by cell type
avg_celltype <- byPeak(expr_file, peak_file, peak_col = "cell_type")
write.csv(avg_celltype, file = "tests/AverageByCelltype.csv", row.names = TRUE, quote = FALSE)

# Run TRIAGEgene
ds_celltype <- TRIAGEgene(avg_celltype)
write.csv(ds_celltype, file = "tests/AverageByCelltype_DS.csv", row.names = TRUE, quote = FALSE)

# Generate Jaccard index heatmap
plotJaccard(ds_celltype, "tests/Jaccard_heatmap_celltype.pdf")

# Run TRIAGEparser
input_file <- "tests/AverageByCelltype_DS.csv"
TRIAGEparser(input_file, input_type = "table", outdir="tests/TRIAGEparser_celltype")

# Generate GO Heatmaps
plotGO(indir="tests/TRIAGEparser_celltype", outdir="tests/TRIAGEparser_celltype")